


Cracking the Crypto Code: Insider Investment Tactics

Some six years ago I co-founded a crypto hedge fund. It was one the very few professional, regulated and fully compliant crypto funds on the market at the time. Covid made things harder, changed some of my partners’ belief in crypto -who wanted the fund to take a new direction, and eventually I came out by 2021, as I didn’t feel it aligned with my values or vision. But this is not what I am going to write about in this post. I learnt many lessons as a fund manager and compliance officer, but the most important one of them all, was that crypto market is like no other market. Quite raw, young, volatile, exciting, and full of surprises.
If you ask any seasoned investor, they’ll tell you the backbone of finding the right investment opportunity is thorough research, which is fundamentally based on data analysis. And this is the crux of cryptocurrency investments: data. You might be thinking that there is an explosion of data on crypto out there, but the reality is, even with hundreds if not thousands of coins, tokens, and multiple blockchain protocols fully open and searchable, yet there’s very little actionable data.
Many cryptocurrencies, including some prominent ones, have only been around for a few years. This short history limits the ability to perform reliable long-term trend analysis. Bitcoin, the oldest cryptocurrency, has only about 15 years of data (of which only 10 years worth of actionable information), while many altcoins have much less. Traditional assets like stocks or bonds have decades of data, which help in identifying more reliable patterns and cycles. cryptocurrencies, on the other hand, lack such established historical patterns, making predictions less certain.
Younger projects are particularly unpredictable. With minimal historical performance to rely on, making informed predictions about their future becomes highly speculative because it’s hard to understand if price swings are part of a broader trend or anomalies. If you add frequent regulatory changes, technological advancements, and market sentiment, it dramatically affects prices in ways that historical data cannot predict. The cryptocurrency market is still maturing.
Lots of “influencers” and other market players produce daily content on how to do technical analysis for crypto, how to spot the next 100x coin/project, and how to identify alpha opportunities. They often use jargon, pompous words, and metrics typically associated with traditional finance investments, but much of it lacks substance. Don’t fall for the clickbait! Investing in cryptocurrencies, particularly young projects, requires a nuanced approach, using a mix of traditional and new metrics, specific to crypto market.
Alright, let's dive into the nitty-gritty of crypto investing. Forget the fluff about teams and whitepapers - we're talking cold, hard numbers and logic here.
First off, one of the key strategies expert crypto investors use is called "on-chain analysis." This is basically like being a digital detective. You're looking at the blockchain data to see how money's moving around. For example, let's say you're eyeing Ethereum. You'd look at metrics like the number of active addresses, transaction volume, and gas fees. Back in 2017, some savvy investors noticed a surge in the number of new Ethereum addresses right before the price exploded. They were onto something big. Today, you can use tools like Glassnode or Nansen to track these metrics in real-time. You can also read my past article where I explain the ins and outs of a crypto bull market and what signals to look for.
When we're talking about active addresses, transaction volume, and gas fees, we're essentially looking at the pulse of a blockchain network. It's like checking the vital signs of a patient. Here's why each of these matters:
Active Addresses: This is the number of unique addresses participating in transactions on a given day. It's a key indicator of network usage and adoption. Steady growth over time is generally positive. It suggests more people are using the network. Sudden spikes can be interesting - they might indicate a new popular app or service launched on the network. For example, Ethereum's daily active addresses grew from about 200,000 in early 2020 to over 500,000 by late 2021. That's a good sign of increasing adoption. A red flag is a consistent decline in active addresses, as it could mean users are abandoning the network.
Transaction Volume: This is the total value being moved around on the network. It's a measure of economic activity. You need to look for high and increasing transaction volume. It means the network is being used for actual economic activity, not just speculation. If transaction volume is high but the number of active addresses is low, it might mean a few big players are dominating the network. That's not great for decentralisation.
Gas Fees: These are the transaction fees users pay to use the network. They can tell you a lot about network congestion and demand. Moderate, stable gas fees are ideal. They suggest steady demand without pricing out smaller users. Rising gas fees can actually be a positive sign in the short term - it means demand for block space is high. Take Ethereum again. During the DeFi boom of 2020-2021, gas fees skyrocketed. While this was problematic for users, it also indicated massive demand for Ethereum block space.
Some red flags to look out for:Consistently high gas fees might drive users to competing networks.
Very low gas fees could mean the network isn't in high demand.
Now, here's the tricky part - you need to look at all these metrics together. For example, if you see active addresses and transaction volume growing, but gas fees staying stable, that's a great sign. It could mean the network is scaling well to meet demand. On the flip side, if you see active addresses dropping while gas fees are rising, that's concerning. It might mean the network is becoming too expensive for regular users.
Remember, these metrics aren't everything. They don't tell you about the quality of the projects being built on the network, or future technological developments. But they give you a solid foundation for understanding the current health and usage of a blockchain network.
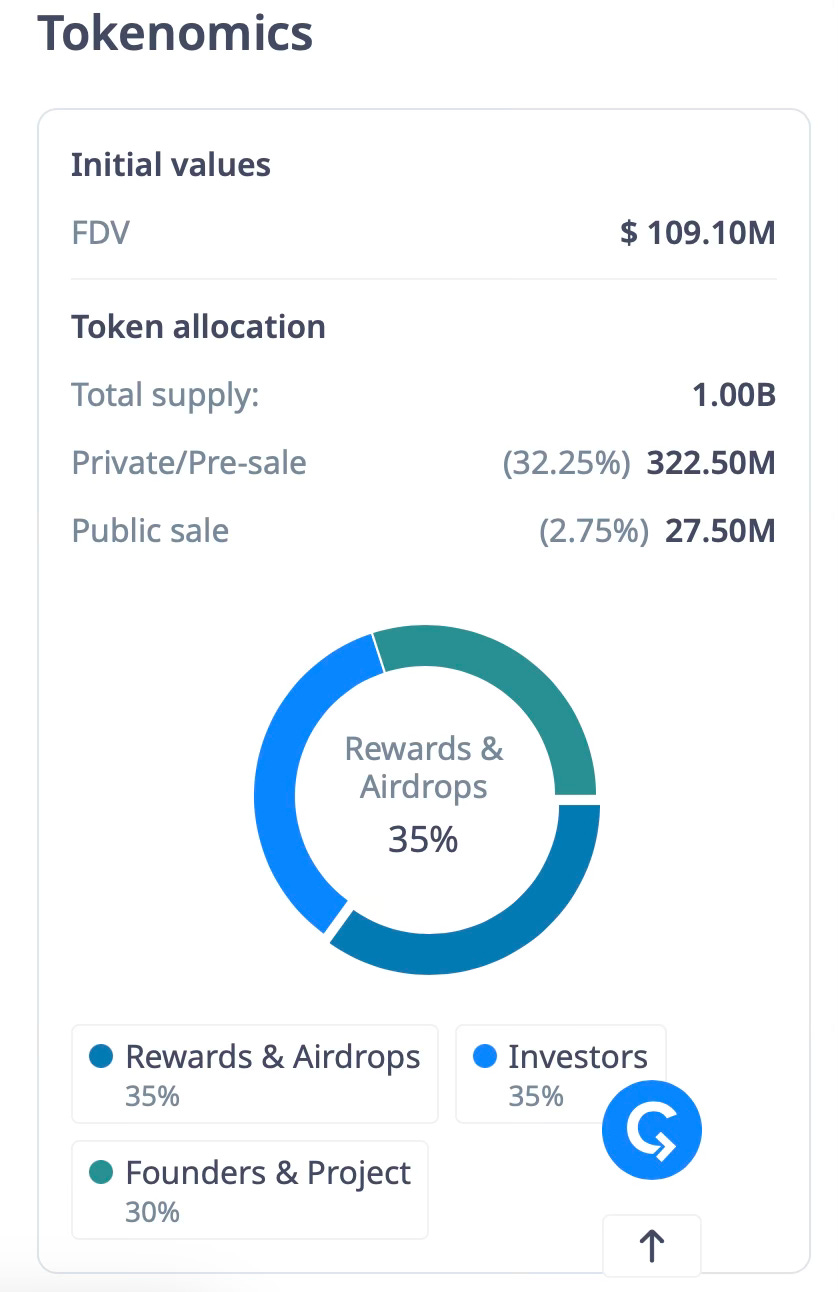
Another crucial tactic is understanding tokenomics. This is all about the supply and demand of a cryptocurrency. This is where the rubber meets the road in crypto investing. It's all about understanding the economic model of a cryptocurrency, which can make or break its long-term value. Let's break it down:
Total supply: this is the maximum number of tokens that will ever exist for a cryptocurrency. It matters, because scarcity can drive value. Think of Bitcoin - there will only ever be 21 million BTC. That scarcity is a big part of its value proposition. Did you know that Ethereum has no fixed cap, but becoming deflationary post-merge? Or that Dogecoin has an infinite supply (yes, really)?
Circulating supply: this is the number of tokens/coins currently out in the wild, available for trading. It gives you an idea of current market dynamics. A low circulating supply compared to total supply might mean there's potential for dilution in the future. For example:
As of 2024, little over 19 million of Bitcoin's 21 million total supply are in circulation.
Some newer projects might have only 10-20% of their total supply in circulation at launch.
Be cautious of projects with a very low percentage of their total supply in circulation. Future token releases could flood the market and tank the price.
Emission rate: how quickly new tokens are being created and released into circulation. High emission rates can lead to inflation, potentially decreasing the value of each individual token. Bitcoin's emission rate halves every four years (the "halving" events) to avoid inflation. I wrote a detailed article about halving here.
A decreasing emission rate over time is often a good sign. It means the supply is growing more slowly, which can be good for price if demand stays constant or grows.

Arbitrum (ARB) emission rate. Source: Token Unlocks Token distribution: who holds the coins - founders, early investors, the community, etc. It affects decentralisation and potential price movements. If a small number of wallets hold a large percentage of the supply, that's a risk. In some newer projects, founders and VCs might hold 30-40% of the supply. A red flag is if a small number of wallets hold a large percentage of the supply. They could potentially manipulate the market.

You can't just focus on one metric though - you've gotta twist and turn all these factors until the whole thing clicks into place. A project might have a low total supply, which sounds good, but if 90% of that supply is held by the founders, that's a huge risk.
Let's take a real-world example: Chainlink (LINK). It has a total supply of 1 billion tokens, with about 500 million in circulation. The emission rate is controlled by the Chainlink team, who release tokens to fund development. This has allowed for steady growth, but some investors worry about potential dilution.
On the flip side, look at Yearn Finance (YFI). It launched with only 30,000 tokens total, all distributed to users. No founder allocation, no VC tokens. This led to a massive price spike initially, but also means there are limited tokens for funding development.
There's no one-size-fits-all perfect tokenomic model. What works for a store of value like Bitcoin might not work for a utility token. The key is understanding how these factors interact and what they mean for the project's long-term sustainability. And remember, tokenomics can change. Some projects have governance mechanisms that allow token holders to vote on changes to the emission rate or total supply. Always stay updated on the projects you're invested in. Tokenomics isn't just about today's price - it's about understanding the economic model that will drive a project's value years down the line. Master this, and you're way ahead of the average crypto investor.
We already established that most cryptos have only been around for a few years, which makes traditional financial models pretty useless. So what do the pros do? They adapt. One approach is using logarithmic regression models. Now that sounds fancy, but it’s really just a technique to understand how prices have grown over time, and to use that information to make educated guesses about where they might go in the future. Imagine plotting the price of a cryptocurrency on a graph over time and then drawing a smooth curve that best fits those points. This curve helps in predicting how prices might change going forward based on the patterns we've already seen. So, it's all about using past growth to get an idea of future trends. It works well for assets that grow quickly at first and then slow down over time.
For younger projects, investors often look at relative valuations. They'll compare a new DeFi protocol to established ones like Aave or Compound, looking at metrics like Total Value Locked (TVL) or revenue per token. It's like trying to figure out the value of a new startup by looking at how much similar companies are worth. By doing this, they can get a rough idea of whether the new project is undervalued or overvalued compared to others in the same space. It's a way of making informed decisions in a market where there's not a lot of historical data to rely on. It's not perfect, but it's a starting point.
Now, let's talk about how things have changed in the last 7 years. Back in 2016, it was the Wild West. You could make a fortune just by being early to a good project. You could stumble upon a good project, throw some money at it, and watch it grow like crazy. It was like finding a gold nugget just laying on the ground.
Arbitrage opportunities were everywhere because markets were inefficient. Arbitrage is just a fancy word for buying something cheap in one place and selling it for more somewhere else. In 2016, different crypto exchanges often had wildly different prices for the same coin. Imagine if a gallon of milk cost $3 in one store and $5 in another right across the street. You could make easy money just by buying from the cheap store and selling to the expensive one. The crypto markets were like a crazy garage sale where nobody really knew the true value of anything. This created tons of opportunities for savvy investors to spot undervalued projects. This was possible because there weren't many big players or sophisticated investors in the space yet. It was mostly tech enthusiasts and early adopters. It was really something else to be able to pool funds with a bunch of other people and invest in a project that you believed in. The community feeling was much stronger than it is today.
So how is it today? It's a whole different ball game. The easy money's mostly gone. Big players have entered the market, and they've got algorithms that can spot and exploit tiny price differences in microseconds. For the average Joe, it's tough to compete. There are still opportunities, but you need to be much smarter to find them. Those price differences between exchanges? They're mostly gone. Big players use high-speed computers to spot and exploit even tiny price differences in milliseconds.
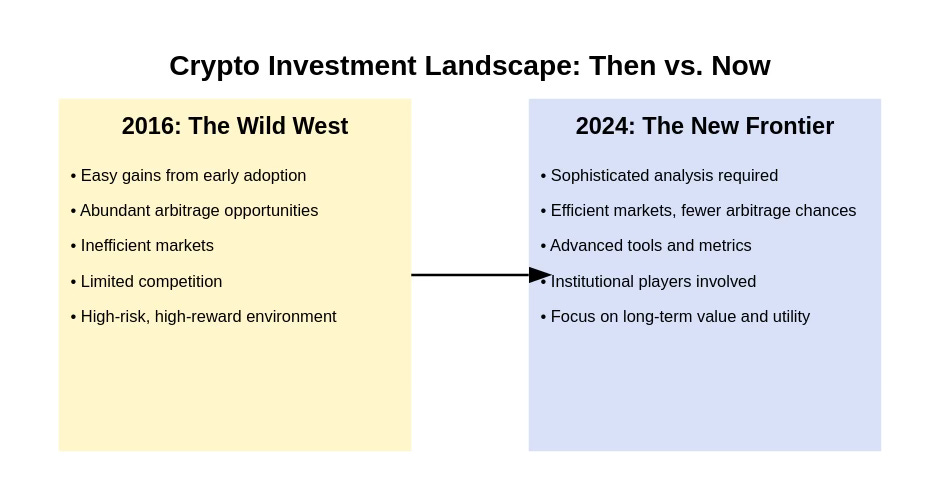
Wall Street has entered the chat. You're not just competing with other individual investors anymore, but with big institutions with deep pockets and sophisticated tools. Instead of just buying and holding, people are doing complex things like yield farming (which is like crypto mining, but with lending and borrowing) or investing in NFTs (digital collectibles). But don’t be discouraged, there’s still plenty of opportunities you can take advantage of. Today, it's all about:
Yield farming: you lock up, or lend out, your crypto assets in a decentralised finance (DeFi) platform. In return, you receive rewards, often in the form of additional cryptocurrency. But watch out - High Annual Percentage Yields (APYs) can be tempting, but they often come with high risks. The value of the crypto you lock up can fluctuate wildly, and the platforms themselves can sometimes be vulnerable to hacks or other technical issues.
NFTs are not just for digital art anymore. Think about blockchain gaming or virtual real estate. NFTs can represent in-game items, characters, or even virtual land that players can buy, sell, or trade. You can have digital worlds where people can buy plots of land or virtual properties. These can be used for various purposes, from socialising to hosting events or even running virtual businesses.
Layer 2 solutions: As popular networks like Ethereum grow, they can become congested, leading to slower transactions and higher fees. This is where Layer 2 (L2) solutions come in. These are technologies built on top of existing blockchains to improve their efficiency. L2 solutions help scale the network by processing transactions off the main blockchain, reducing congestion and costs. Investors see Layer 2 solutions as crucial for the future growth and usability of these networks.
Back in the day, understanding blockchain basics could give you an edge. Now, you need to understand complex financial products, market dynamics, and keep up with rapidly evolving tech and metrics. However, you don’t have too much to worry if you’re a hodler of major cryptocurrencies and you’d rather have a long-term diversified portfolio. It’s good to be up to date with what’s new in the market though, to add new gems to your portfolio.
The good news? The barriers to getting started are lower. It's easier than ever to buy crypto. But to really succeed, you need to be smarter and more strategic than ever before. You've got user-friendly exchanges, crypto debit cards, and even Bitcoin ETFs now. But the knowledge barrier? That's higher than ever. There's still money to be made, but it requires more knowledge, better tools, and a solid strategy.
Here's the bottom line, crypto investing in 2024 is less about gambling on moonshots and more about understanding complex financial products and market dynamics. It's not enough to just buy and hold anymore. You need to be actively managing your portfolio, staying on top of tech developments, and always, always doing your own research.
Remember, though, this stuff is still highly speculative. Even the experts get it wrong sometimes. So never invest more than you can afford to lose. That's the golden rule, whether you're dealing with Bitcoin, altcoins or penny stocks.
Until next time, happy hodling and may your charts always be green!
P.S. Don’t forget to refer a friend and earn your rewards!